What is No Intention to Pay? Is it still an increasing challenge for businesses?

Exacerbated by changing consumer circumstances and evolving fraud tactics, the issue of No Intention to Pay (NITP) has seen changing trends across the past 12 months
This blog explores NITP – a constant problem for some but a grey area of where responsibility lies. Effective mitigation requires robust data and processes across both credit risk and fraud, with the ability to react quickly to external challenges and opportunities.
In an ever-changing economic climate and demand for credit, the need and desire to effectively identify those individuals who will pay you and those which won’t is constant. Consumer circumstances can change and result in previously affordable bills being a challenge. At the same time, fraudsters continue to evolve and look for vulnerabilities to exploit. We observed increased levels of fraud in 2023 which has continued into 2024, along with changes between third-party and first-party fraud rates. (c.75% of personal loan fraud is categorised as third-party in Q1 2024).
The challenge of No Intention to Pay (NITP) is clear, but in many instances, the ownership isn’t, spanning both credit risk, and fraud prevention. It’s important to take a holistic approach – using both credit risk and fraud team analytics to best understand and interpret the risk to your business, sector, and mitigation methods.
Is No Intention to Pay a problem for all sectors?
When considering delinquency KPIs at a UK market level the current trend is one of being under control and still linked to risk, with a slight uptick after a period of improved performance in early to mid 2023. We are still seeing seasonal trends, and early arrears roughly predicts a traditional credit risk definition of 2+ arrears at 12 months of account opening… and is likely to increase as markets have opened and clients consciously taken on more riskier lending, particularly in the unsecured vertical.
Now when we come to look at arrears due to NITP, the first question to consider is how to define it.
What is No Intention to Pay?
There doesn’t seem to be a single, consistent definition used across all sectors; you can change the definition, and the absolute losses change but the overall trends don’t. So, we are keen to move away from the debate over the definition to spend time on understanding the size and any sector differences to the problem.
By using a ‘default at 6 months’ definition, we see an overall decreasing UK market NITP trend as shown in Figure 1. Interestingly, NITP only makes up approximately 25% of 2+ arrears at 12 months and 10% of total defaults. So, whilst NITP is an issue to solve it can’t be the single focal point and needs to be one element of an overall risk strategy.
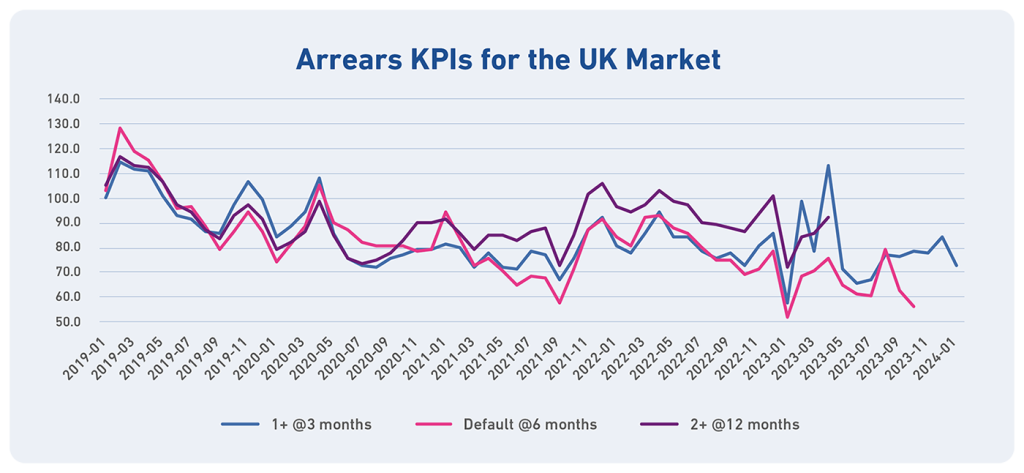
Figure 1: Arrears KPIs for the UK Market (Indexed to the 2019 average)
Does NITP have the same level of concern across different sectors?
By separating out the wider UK population, it becomes evident that the overall market trend is masking sector (and sub-sector) differences. As expected, we see secured lending having very low, if any, levels of NITP. Unsecured lending and retail finance show varying degrees of NITP, with Telecommunications suffering the greatest levels of losses.
Taking a closer look at Telecommunications and splitting this out into the continued expansion of operators into device financing (through a personal loan agreement) and separate data / airtime and non-mobile propositions, we see different trends. Initial launches of financing propositions have resulted in increased NITP rates which have been followed by periods of tightened strategy to mitigate losses with a resultant impact on acceptance rates. What is interesting within this sector is NITP rates for device financing equate to just over 40% of 2+ arrears at 12 months.
Other sectors which on the surface appear to have a flat to declining NITP trend are also seeing differences when splitting into sub-sectors.
In retail finance, seasonal arrears trends show a very close alignment between early arrears and delinquency at 12 months; however, NITP doesn’t follow these patterns and is decreasing. However, by splitting out fixed term and mail order portfolios this paints a very different picture. Fixed term lenders have tightened up their credit policy but when opening this back up again we see NITP increasing. Mail order on the other hand shows a stable NITP position since the middle of 2021, albeit slightly ticking up again in the middle of 2023, and makes up a very low proportion of delinquency at 12 months.
When considering credit cards, NITP has been increasing but at a lower rate than delinquency at 12 months. As expected, there are marked differences between cards provided by banks compared to non-bank credit cards. Both sub-sectors have seen increasing NITP trends over the last couple of years followed by a recent period of stability. There have been several new entrants into the non-banks cards market who have looked for market share, which contributed to the increase and higher levels of NITP in this sub-sector. Interestingly, the tightening of credit policy at the end of 2022 did not translate into significantly lower NITP rates.
Personal loans show NITP remaining stable and aligning closely to early account arrears. The proportion of NITP to delinquency at 12 months has reduced and is currently sitting at 15%. When splitting this out into sub-sectors there are noticeable differences between personal loans provided by banks, non-traditional (non-bank) lenders and credit unions. The sub-prime personal loan market is being hit by NITP and there have been several lenders pair back or withdraw from the market.

However, sub-sector trends can also mask issues for individual lenders. Depending on your individual portfolio trends and how closely NITP aligns to short- and longer-term delinquency definitions can influence how you go about tackling this challenge.
In summary, there are (sub-)sector differences and some clients are more affected than others but primarily the problem appears to be the most challenging for Telecommunications and to a lesser degree the sub-prime personal loan markets.
What can you do to mitigate this risk?
When reviewing individual NITP trends for different organisations, the first theme to stand out is to do the basics right. Many client conversations have focus on increased levels of sophistication and capabilities to close the gap and cut-off new fraud profiles and modus operandi. However, key business strategies can be improved, for example:
- Do you have consistent identity and fraud capabilities and processes across different channels, in particular around the launch of new products and services?
- Are you stopping ‘repeat offenders’?
- Are ‘high-risk’ addresses being used within applications? That is, addresses where defaults have been registered against different individuals who are apparently living there
Once you’ve closed any obvious gaps, how well do your existing scores predict NITP and are your models based solely on credit or fraud data? The inclusion of both traditional credit risk data alongside identity and fraud data within your models will provide the greatest chance of highlighting NITP attacks. Examples of data services to enhance your fraud screening are:
Application inconsistency and velocity screening
Fraud consortium data
Device intelligence and behavioural biometrics
Email and mobile verification
Bank account and credit card verification
Document verification
Compliance screening
As well as additional data sources, improved model discrimination can also be delivered through utilising latest machine learning techniques.
How can we support operators to address these challenges?
The need to maximise the value of data, align strategy across credit risk / fraud and trading teams and react quickly both to external challenges and opportunities has never been greater.
Experian’s team of experienced consultants already support many organisations with data, analytics and software capabilities to help identify areas of opportunity and deliver improved business performance across many of these challenges. At a high-level, examples of where we can support you are:
- Review and benchmark credit risk and fraud business performance, across the key areas of the lifecycle; from acquiring new customers through to customer management and collections
- Identify and support more effective use of CRA data, identity and fraud solutions, and how this can drive significant business improvement
- Identify and support current and future strategy and model development; quantifying where new capabilities meet business challenges and would deliver significant value
- Understanding and improving the quality of your customer data to support improved customer outcomes and regulatory compliance, particularly through transformation programmes and new proposition launches
Contact us
Contact our consulting team for more about No Intention to Pay or your other credit risk and fraud challenges.
Let's talkFurther reading

Trade credit in business: A guide
Trade credit allows businesses to buy goods and services from other companies without paying immediately. Understand the types, uses, pros and cons.

The Future of Fraud: 7 Key Predictions for 2026
What fraud trends are we anticipating for 2026? Read our seven predictions to explore the potential impact of growing fraud and identity threats.

Is Net Zero yesterday’s issue for SMEs…? Key points from the Net Zero Census 2025
The 2025 Net Zero Census, the defining survey of UK business’ engagement with the Net Zero transition, was published in October. For SMEs and micro-businesses the results confirmed three things.

Update on key utilities trends: Unpicking arrears in energy
Explore why energy debt has surged by over 150% in two years and what utilities providers can do to respond. Learn how data quality, customer insight, and best practice collections strategies can improve outcomes.

Verification of Payee
Learn how Verification of Payee helps protect payments, prevent fraud, and build trust with customers.

Do you know your customers?
Get your data in the right shape. The Know Your Consumer (KYC) regulation is a critical framework that ensures consumer protection and transparency.

Data Catalogue: Cataloguing for Effective Data Governance
Learn about data catalogues and their role in guiding organisations to manage, discover, and utilise vast information resources effectively.

ModelOps Report 2024
Our latest report shows you how to overcome barriers to accelerate, maintain and deploy the next generation of predictive analytical models.

Why your business needs behavioural biometrics for fraud protection
Biometric authentication has become a powerful tool in the fight against fraud. Find out why a multi-layered approach is needed in 2024.