Assessing commercial affordability using categorised bank account data
Understanding true income and expenditure of your SME Portfolio is key to getting affordability assessments right
In this article, we explore how our categorisation engine can give a more granular view of SME accounts.
Traditionally, lenders have had to use their own internal current account data or relied on bank statements to assess SME affordability. Open Banking, however, has changed all that, and has opened up a world of granular bank account data which can be used in affordability calculations.
The Open Banking Directive was born out of the Payment Services Directive 2 (PSD2) regulations, implemented in the UK in 2017. It mandates the largest banks to make their current account data available at a transactional level, based on a consent-based regime and underpinned by new security measures to keep the data safe. This has made available extremely granular, transactional data on income and expenditure items for both consumers and businesses. With the end user’s consent, this information can be shared via APIs and integrated into other services. Consent is not only required but it needs to be reconfirmed to continue using the data in proportionate and relevant ways. This data can then be categorised to help give a clear picture of expenditure.
Categorised data in affordability assessments
Categorised bank account data (whether from existing customer accounts in a bank or via Open Banking), enables a more detailed view of an SMEs income and expenditure than the aggregate credit and debit turnover and balance data available under CATO (current Account Turnover). It enables a granular view of income streams and can exclude non-income sources such as a loan paid into the bank account or internal account transfers. It can also provide an in-depth view on the costs of the business.
Categorised account data provides a ‘pseudo’ management accounts view. Because of this, it is possible to understand the actual level of net free cash flow within the business. It can also ensure that affordability better aligns to the capability of the business to repay debt. This is much better than using sector-level views on typical margins because, by their nature, these cover all businesses and so there needs to be a level of conservatism applied to these in order to ensure a sensible risk-based approach. Having a specific view of both the cost and income of a business means elements of this conservatism can be removed.
This granular view of income and expenditure enables specific elements to be better understood, such as types of revenue, nature and make up of their cost base, director dividends, and fixed costs versus variable costs. These produce a much richer picture of the business and help ascertain aspects of fixed versus variable costs, likely breakeven points, levels of residual income, and so on.
When it comes to calculating affordability, this more granular view means a more business ‘personalised’ approach can be taken, as the true nature of the business costs are understood. It means that the lender knows what their actual margin is as opposed to relying on sector-level assumptions. Taking these figures into account along with the trends in income and costs, lenders get a much better insight into whether a business is growing or declining. It can provide views into measures such as income, cost and profitability, changing efficiency, issues concerning how the business is run and so on. This offers a new dimension on affordability calculations and helps make assessments concerning business risk.
Experian’s categorisation engine
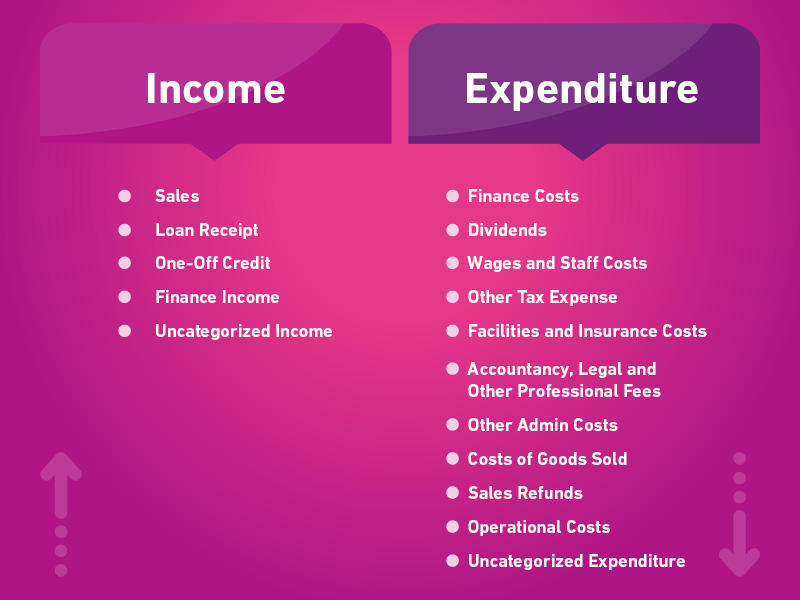
In our categorisation engine, we have created an affordability-based aggregate model. It includes the following high-level categories to provide a breakdown of income and expenditure for a business. A further 48 sub-categories (Vehicle; Utility; Software, etc.) sit beneath these.

This breakdown provides a more in-depth picture on a business and enable some of the challenges within CATO data to be removed on credit. More importantly, however, it provides an accurate view on costs. Debit turnover on CATO does not provide this level of resolution.
To see why this is important, consider a business operating on a 30% margin but which pays the owner a handsome salary. In this case the two might cancel each other out with debit turnover equalling credit turnover through the year.
Having the granular view of cost and an accurate view of income enables a business-specific “free cash flow” value to be calculated. This can be used to ascertain the affordability of any facility. This would be akin to the CATO/CAIS method but instead of using a sector factor it uses either the actual business margin or the data as pseudo management accounts, but without the balance sheet items (which could instead be taken from statutory accounts).
With this more in-depth view it enables higher and safer lending limits to be calculated. Of course, it is still important to understand the view from CATO and CAIS alongside this to confirm the picture is accurate. One can imagine an example where Open Banking is viewed on a single account of a multi-banked business, thus potentially leading to an inaccurate interpretation by ignoring the other accounts. Similarly, business borrowing may not all be paid out of the categorised account and so CAIS will provide a view on all facilities they have as well as the total level of borrowing, maturity dates, arrears, etc. to fill in the gaps from the current account.
By combining current account information with categorised expenditure data, you can get a more complete view of SME affordability helping give you greater confidence in lending decisions.
How can we help?
To find out more about how we can support you in better understanding the affordability of your SME customers, get in touch.
Income: Sales, Loan Receipt, One-Off Credit, Finance Income, Uncategorized Income
Expenditure: Finance Costs, Dividends, Wages and Staff Costs, Other Tax Expense, Facilities and Insurance Cost, Accountancy, Legal and Other Professional Fees, Other Admin Costs, Costs of Goods Sold, Sales Refunds, Operational Costs, Uncategorised Expenditure


